This line of research focuses on leveraging object tracking techniques to analyze how the behavior of a parallel application evolves through different scenarios. Our versatile approach allows for a wide scope of studies, including multiple time intervals within same experiment and multiple executions with different configurations. This enables the user to perform very diverse parametric and evolutionary studies, to see which factors (i.e. hardware, software versions or program configuration variables) have bigger impact on the resulting performance, foresee trends in future experiments and better understand how and why the behavior of the program evolves. Our approach mimics the threefold structure of a visual tracking algorithm, including:
- Generation of a sequence of images. Each execution scenario is represented as a 2D performance space defined by a given pair of metrics (i.e. IPC and Instructions). Then, every computation of the program is depicted in this space according to their performance behavior.
- Object recognition within each image. Clustering is used to group all computations presenting similar behavior. In this way, we are able to automatically identify in the performance space a set of different performance trends exhibited by the most relevant code regions.
- Motion analysis of the objects across images. We analyze the whole sequence of images to see the evolution of these performance trends across scenarios.
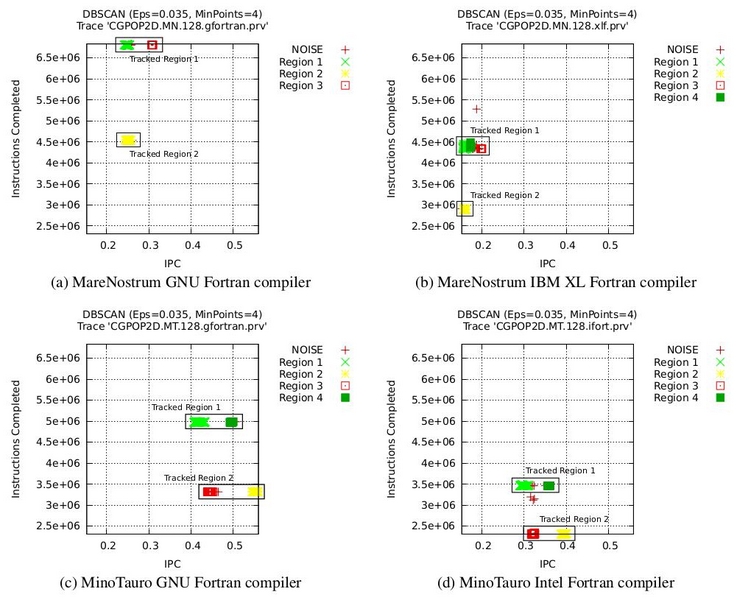
As a result, this tool produces a sequence of scatter plots showing changes in the performance characteristics of the different code regions. This representation enables to easily identify behavioral variations and perturbations. In the following example you can see how the performance of the main code regions in CGPOP varies depending on the architecture and the compiler used.

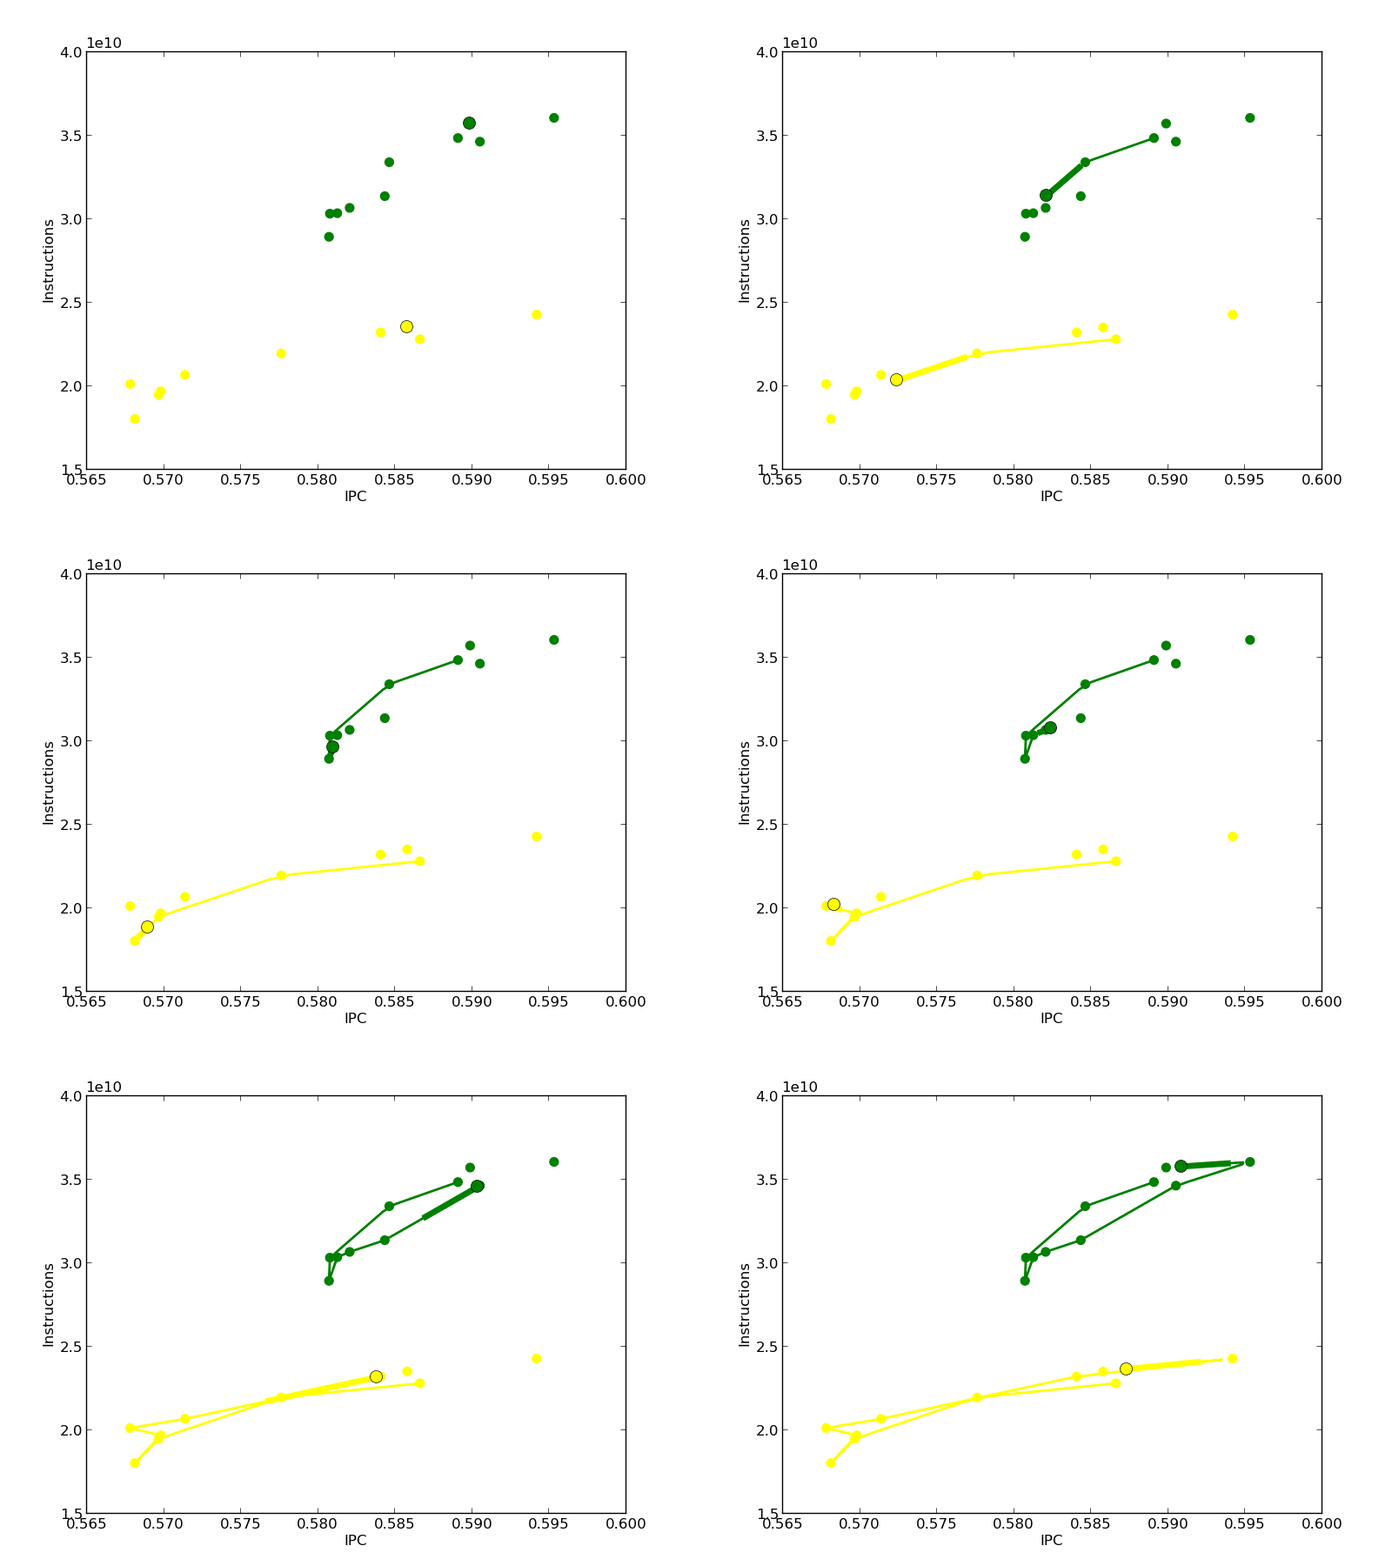
These performance alterations can be displayed in simple trajectory animations, where you can easily track the movements across the performance space. In this example of the atmospheric general circulation model ECHAM5, it is easy to identify both IPC (horizontal) and Instructions (vertical) fluctuations for the two main code regions, which can be good indicators of potential load-imbalaces.

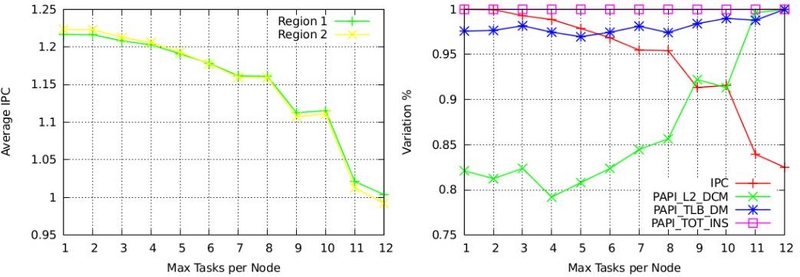
In addition, the tool illustrates the evolution of every code region from the first scenario to the last with respect to the performance metrics selected to generate the images. Next figure shows trend line charts displaying the decreasing evolution in IPC for the two main regions of MR-Genesis when increasing the multi-core resource sharing from 1 to 12 processes per node (left), and a correlation of all performance metrics considered (right) where you can see that the decrease in IPC is connected to an increase in the number of memory misses.


