Paraver was developed to respond to the need to have a qualitative global perception of the application behavior by visual inspection and then to be able to focus on the detailed quantitative analysis of the problems. Expressive power, flexibility and the capability of efficiently handling large traces are key features addressed in the design of Paraver. The clear and modular structure of Paraver plays a significant role towards achieving these targets.
Paraver is a very flexible data browser that is part of the CEPBA-Tools toolkit. Its analysis power is based on two main pillars. First, its trace format has no semantics; extending the tool to support new performance data or new programming models requires no changes to the visualizer, just to capture such data in a Paraver trace. The second pillar is that the metrics are not hardwired on the tool but programmed. To compute them, the tool offers a large set of time functions, a filter module, and a mechanism to combine two time lines. This approach allows displaying a huge number of metrics with the available data. To capture the experts knowledge, any view or set of views can be saved as a Paraver configuration file. After that, re-computing the view with new data is as simple as loading the saved file. The tool has been demonstrated to be very useful for performance analysis studies, giving much more details about the applications behaviour than most performance tools. Some Paraver features are the support for:
- Detailed quantitative analysis of program performance
- Concurrent comparative analysis of several traces
- Customizable semantics of the visualized information
- Cooperative work, sharing views of the tracefile
- Building of derived metrics
The following are major features of the Paraver philosophy and functionality
Contents:
- Supported programming models
- Views
- Expressive power
- Quantitative analysis
- Multiple traces
- Large traces
- Cooperative analysis
- Derived metrics
- Batch processing
Supported programming models
Paraver is not tied to any programming model as long as the model used can be mapped in the three levels of parallelism expressed in the Paraver trace. An example of a two-level parallelism would be hybrid MPI + OpenMP applications. The runtime measurement system Extrae that generates Paraver traces currently supports the programming interfaces MPI, OpenMP, pthreads, OmpSs and CUDA.
Views
Paraver offers a minimal set of views on a trace. The philosophy behind the design was that different types of views should only be supported if they provide qualitatively different types of information.
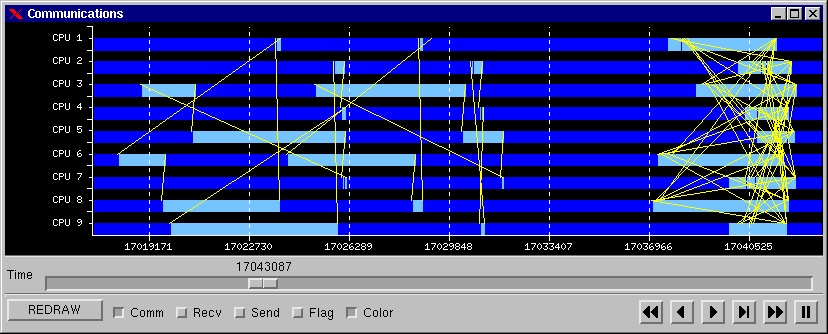
Performance information in Paraver is presented with two main displays that provide qualitatively different types of information. The timeline display represents the behavior of the application along time and processes, in a way that easily conveys to the user a general understanding of the application behavior and simple identification of phases and patterns. The statistics display provides numerical analysis of the data that can be applied to any user selected region, helping to draw conclusions on where and how to focus the optimization effort.
 |
 |
The single type of graphic view is flexible enough to represent visually a large amount of information and to be the reference for the quantitative analysis. The Paraver view consists of a time diagram with one line for each represented object. The types of objects displayed by Paraver are closely related to the parallel programming model concepts and to the execution resources. In the first group, the objects considered are: workload, application, task and thread. Although most frequently is used to visualize a single application, Paraver can display the concurrent execution of several parallel applications. In the resources group, the objects considered are: system, node and CPU.
Paraver displayed information consists of three elements: a time dependent value (called semantic value) for each represented object, flags that correspond to punctual events within a represented object, and communication lines that relate the displayed objects. The visualization module determines how each of these elements is displayed. With it is possible to change the types of representation, colors and scales.
The visualization module blindly represents the values and events passed to it, without assigning to them any pre-conceived semantics. This plays a key role in the flexibility of the tool. The semantics of the displayed information (activity of a thread, cache misses, sequence of functions called ) lies in the mind of the user. Paraver specifies a trace format but no actual semantics for the encoded values. What it offers is a set of building blocks (filter and semantic modules) to transform the trace in the visualization process. Depending on how you generate the trace and combine the building blocks, you can get a huge number of different semantic magnitudes visualized.
Expressive power
The separation between the visualization power (how to display) and the semantic module (value to display) offers a flexibility and expressive power above what is frequently encountered in other tools.
Many visualization tools include a filtering module to reduce the amount of displayed information. In Paraver, the filtering module is in front of the semantic one. The result is added flexibility in the generation of the value returned by the semantic module.
 |
Paraver semantic module is structured as a hierarchy of functions that are composed to compute the value passed to the visualization module. Each level of function corresponds to one level in the hierarchical structure of the process/resource model on which Paraver relies. |
Combining very simple semantic functions (Sum, Sign, State As Is, Last Event Value ....), at each level, a tremendous expressive power results. Besides the typical processor time diagram, for example it is possible to display:
- The global parallelism profile of the application
- The total per CPU consumption when several tasks share a node
- Average ready queue length of ready tasks when several tasks share a node
- The instantaneous communication load geometrically averaged over a given time
- The evolution of the value of a selected variable
- The instructions per cycle executed by each thread
- The load balance of the different parallel loops
Using configuration files, to obtain these views is as simple as to load a file.
Quantitative analysis
Qualitative behavior display is not sufficient to draw conclusions on where the problems are or how to improve the code. Detailed numbers are needed to sustain what otherwise are subjective impressions. The quantitative analysis functions are applied after the semantic module in the same way as the visualization module. Again here, very simple functions (average, count....) combined with the power of the semantic module result in a large variety of supported measurements. The quantitative analysis module of Paraver can be applied to any user selected section of the visualized application and has two variants:
- The 1D analysis computes the values on the semantic function of the selected window. It includes features such as being able to measure times, count events or compute average value of the displayed magnitude.
- After some experience, maximizing the amount of information obtainable by the combination of semantical analysis functions becomes a challenging issue for Paraver users.
Multiple traces
This multi-trace feature supports detailed comparisons that otherwise would become very subjective or cumbersome. For example, it is possible to compare:
- Two versions of code
- Behavior on two machines
- Difference between two runs
- Influence of problem size
- Application scalability
Large traces
A requirement for Paraver was that the whole operation of the tool has to be very fast in order to make it usable and capable to maintain the developer interest. Handling traces in the range of tenths to hundreds of MB is an important objective of Paraver to enable the analysis of real programs. Easy window dimensioning, forward and backward animation and zooming are supported. Several windows with different scales can be displayed simultaneously. Even on very large traces, the quantitative analysis can be carried out with great precision because the starting and end point of the analysis can be selected on different windows.
The tracefiles are usually managed in ASCII format to allow portability between different platforms, but the tool domapfile can be used to translate the tracefile to binary format reducing its size and the time needed to load it.
Cooperative analysis
The configuration files allow to share the knowledge and expertise using Paraver. Once a desired view is obtained, it can be stored in a configuration file to apply it again to the same tracefile or to a different one. Sharing the tracefiles and the corresponding configuration files allow to easily share views of the trace and the information obtained.
Derived Metrics
Following the philosophy of Paraver, the derived metrics are simple and powerful: the user can combine two displaying windows of a tracefile using very simple operators (add, product, maximum,..) to obtain a new semantic function. Applying this procedure recursively, it is possible to obtain semantic functions like:
- Instructions per cycle within a parallel function
- FLOPS per milisecond
- FLOPS per TLB miss
Batch processing
In some cases it can be interesting to use all the analysis capabilities of Paraver without using the GUI interface. This is the case of:
- doing parametric studies
- using the analysis results as input for automatic optimization
To allow these type of studies, we have developed Paramedir (in Spanish means "to measure"). Paramedir is a new version of Paraver that does not have GUI. The basic commands (trough the binary or API interfaces) allow to load a tracefile, load a configuration file and save the results of the analysis in a text file. The strength of this version is that it uses the same configuration files than Paraver so the same analysis carried out with the GUI can be saved on a configuration file and later applied to many tracefiles with Paramedir.
We do not recommend to use Paramedir blindly to do performance analysis. Our experience is that it is very important to keep looking at the timelines details that some average values can mask.