Applications structure detection using cluster analysis
Cluster analysis, or clustering, is one of the most used explorative data mining techniques used for classification of data. The data elements are partitioned into groups called clusters that represent collections of data elements that are proximate based on a distance or dissimilarity function. For example, cluster analysis has been used to group spatial location prone to earthquakes or group related documents for browsing.
Inside the parallel performance analysis group, we applied cluster analysis to detect different trends in the application computation regions with minimum user intervention. This detection provides an unique insight of the application behaviour that serves as a starting point to perform different types of analyses around the applications' computation structure.
1. Computation structure detection using DBSCAN
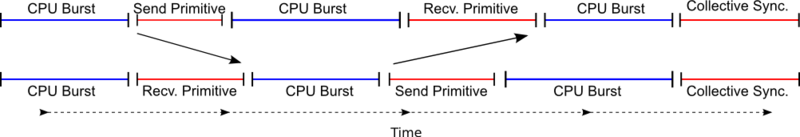
Firstly, it is absolutely necessary to define which are the elements we want to group. In this research, we search the trends of the different 'CPU bursts' (or simply 'bursts') of an application. We define a 'CPU burst' as the region in a parallel application between calls to the parallel runtime, for example a message passing in MPI or entering to a parallel region in OpenMP. We consider this as the minimum computation unit of the application, which offers a desired granularity without compromise of the application functional design.
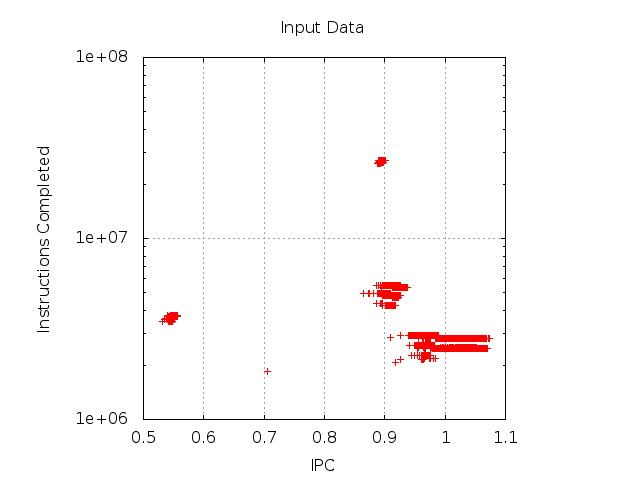
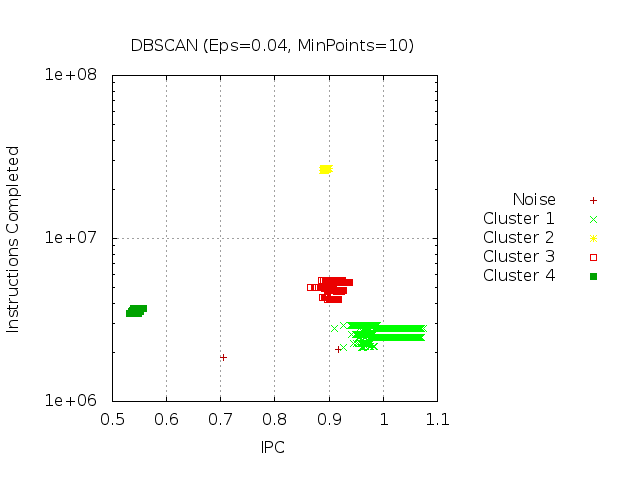
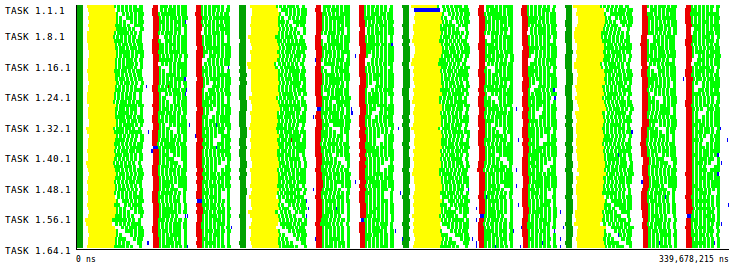
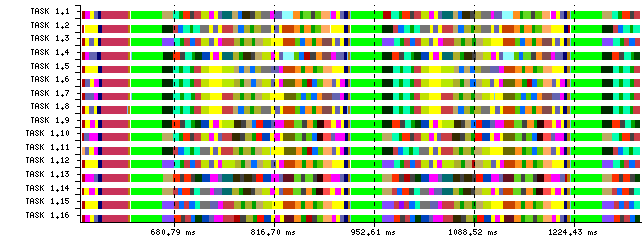
To describe each of the CPU burst of a parallel application, we make use of the Performance Hardware Counters offered by current microprocessors. After a filtering and normalization stage, to ensure the quality and representativity of the bursts, we apply DBSCAN cluster algorithm. As a result, we obtain the different groups of bursts according to the performance counters used. For example, we use to combine Instruction Completed and Instructions Per Cycle (IPC) metrics so as to reflect the different performance obtained by the different bursts along the application execution. In Figures 2 and 3 we can see the ra w data and the results of the cluster analysis, respectively. In Figure 4, the detected groups reflect the structural patterns of the computation phases, the bursts, of a parallel application.
About DBSCAN algorithm
The clustering algorithm we use is called DBSCAN (for Density-Based Spatial Clustering of Applications with Noise), the most representative density based algorithm. The DBSCAN algorithm requires two parameters, Epsilon (or Eps for short) and MinPoints. The resulting clusters are the different subsets of the data space with more than MinPoints individuals, where all points have at least one neighbor at distance less than Eps. The points which do not fall in any cluster are marked as noise. Conceptually, this definition determines that the cluster of the data set are those groups 'close enough' (Eps parameter) and 'dense enough' (MinPoints parameter).
We take advantage of of one of the key facts of density-based clustering algorithms: the no assumption in the underlying data distribution. As demonstrated in Performance Hardware Counters data do not always follow a fixed distribution, so other clustering algorithms that search for Gaussian clusters, such as the K-means-like family, obtain poor results in this scenario.
 description |
 |
 |
|
2. SPMD structure evaluation
As a huge number of parallel applications that run on clusters follow the Single Programm Multiple Data (SPMD) paradigm, we offer a technique to evaluate the SPMD structure in a quantitative way. We call this the SPMDiness of the application. To evaluate this SPMDiness we use a Multiple Sequence Alligment (MSA) algorithm, widely used in bioinformatics. The underlying idea of the technique proposed is: in an SPMD application all tasks should be executing the same sequence of actions. In this context, the MSA algorithm will align the sequence of actions of each task and afterwards, processing the resulting alignment, we can produce the SMPDiness score.
This technique has a direct applicability to the clusters obtained using the computation structure detection previously described. Using it, the input sequence of actions required by the MSA algorithm will be the sequence of clusters of each task. After applying the MSA and quantifying the alignment, we produce the Score per Cluster, i.e. how well a cluster represents a SPMD region, and also the Cluster Sequence Score, a combination of the different cluster scores the measures the SPMDiness of the computation regions.
 |
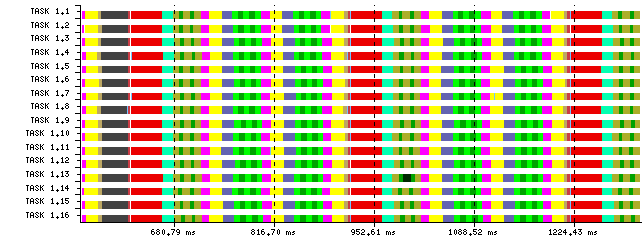 |
 Figure 5: Structure detection with poor SPMD and its corresponding alignment |
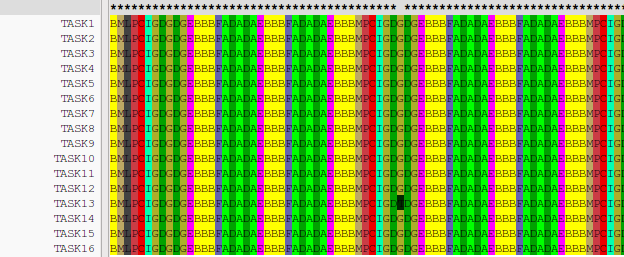 Figure 6: Detailed SPMD structure detection of the same application Figure 6 and its corresponding alignment |
This two Figures present two possible structure detections of a given application using DBSCAN with different Eps parameters. Time-lines 5a and 6a clearly show this different quality in terms of the SPMD. Alignments 5b and 6b are the result of applying an MSA algorithm to the previous sequences and serve as the input data to quantify the SPMDiness numerically, the Cluster Sequence Score.
3. Aggregative Cluster Refinement
The last results of this research line consists on a new cluster algorithm, the Aggregative Cluster Refinement. This new algorithm is designed to overcome some problems detected in the regular DBSCAN while reducing the user intervention on its parametrization. In brief, the Aggregative Cluster Refinement is an iterative algorithm that makes use of DBSCAN algorithm on each iteration and applies a prune to the resulting clusters using an score. Inspired by hirerachical cluster algorithms, the Aggregative Cluster Refinement builds a pseudo-dendrogram, a tree that reflects the hierarchical relationships of different clusters.
Using CPU bursts data and the Cluster Sequence Score, the Aggregative Cluster Refinement is able to detect the computation structure at fine-grain, with minimum user intervention (actually, the user just have to provide the input date). In addition, the pseudo-dendrogram is an unique insight of parallel application behaviour so it reflects how each SPMD regions performs at different levels of granularity.
 |
 |
 |
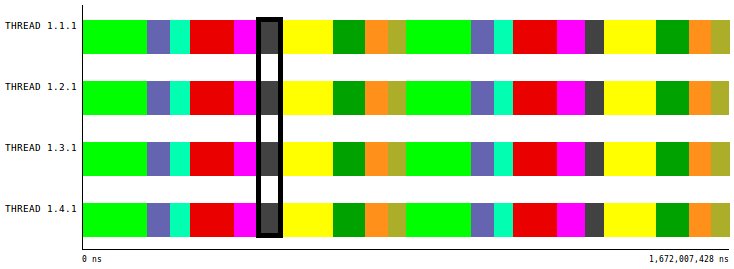 |
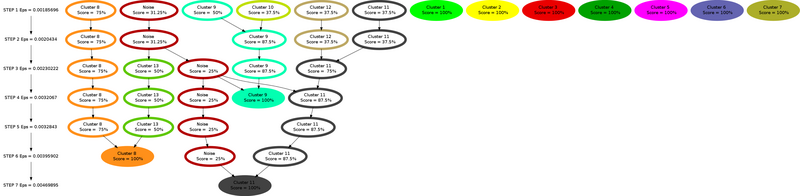
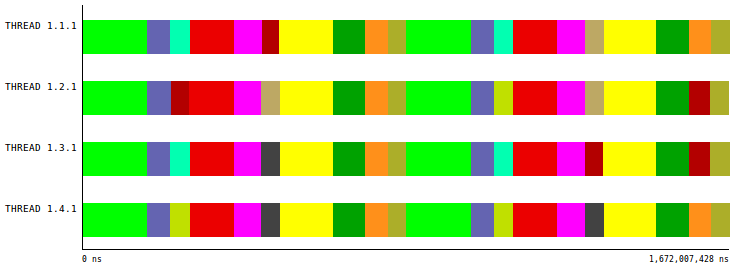
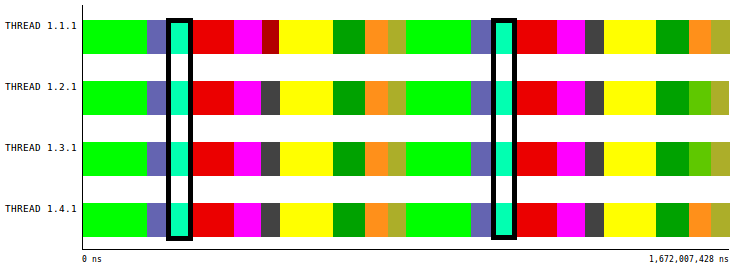
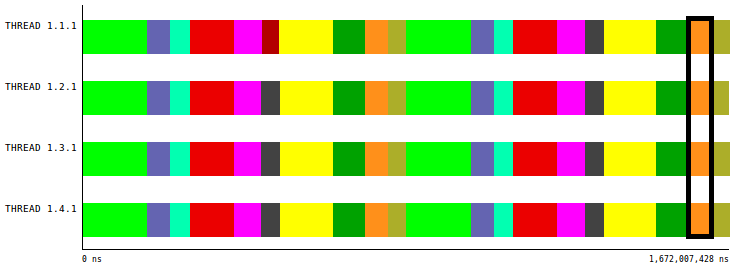
Last two Figures present a simple example of the Aggregative Cluster Refinement. Figure 7 shows the pseudo-dendrogram (or refinemnt tree) produced by the algorithm where the nodes of the tree filled represent those clusters that reached a perfect Cluster Sequence Score. Figure 8 contains the time-lines corresponding to those steps (iterations) of the algorithm where clusters with perfect score appear (marked with black boxes).
4. Practical Uses
4.1 Extrapolation of performance data
In some cases it is needed to execute an application several times to obtain different metrics that cannot be read simultaneously, for example when using processor hardware counters. The performance data extrapolation technique solves this problem by multiplexing the data acquisition along the (repetitive) application phases, and then extrapolating the average values per phase of a wide number of performance metrics.
This extrapolation relies in an accurate distinction of the application phases. This can be done, for example, by adding events manually to the applications source code, but thanks to the cluster analysis, the analyst can avoid the tedious task of manually instrument while obtaining good results.
4.2 Reduction of input data for a multilevel simulation
Detailed simulations of large scale message-passing parallel applications are extremely time consuming an resource intensive. We designed and validated a methodology, depicted in Figure 9, where the structure detection based on cluster analysis is combined with signal processing techniques capable of reducing the volume of simulated data by various orders of magnitude. This reduction makes possible detailed software performance analysis and accurate predictions in reasonable time.
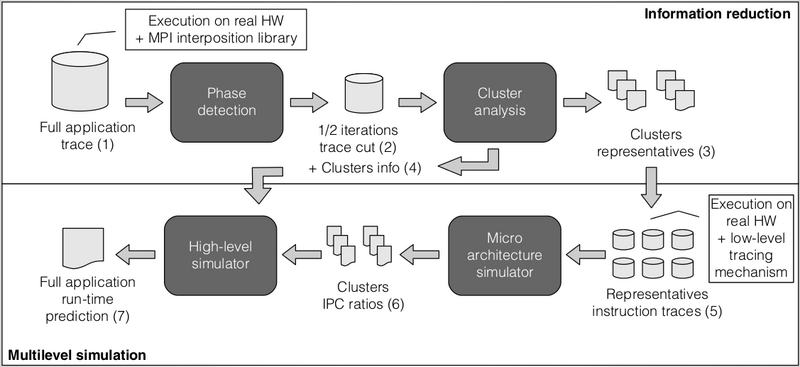
In this case, the use of the cluster analysis inside the methodology proposed takes advantage of the summarization, i.e. the use of representatives per cluster. In this scenario, the (extremely expensive) micro-architectural simulation time is dramatically reduced by carefully selecting the CPU bursts to simulate using the information provided by the cluster analysis, corresponding to the Point 3 in the Figure. Thanks to the strong statistical foundation of the cluster analysis, the use of representatives instead of all individuals adds a minimum error to the final simulation.