This line of research explores the application of intelligent analysis techniques in order to filter the data as it is being collected to minimize the amount of data emitted into the trace, while maximizing the amount of relevant information presented to the analyst. To this end, we have developed an on-line framework on top of our monitoring system Extrae, that brings together several components and automatic analysis techniques:
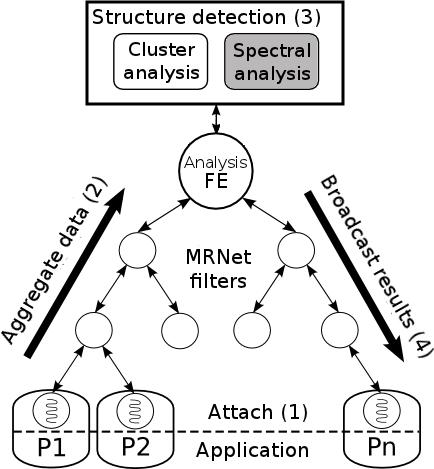
- Extrae automatically attaches to the running application to extract hardware counter metrics (i.e., instructions issued, cache misses, etc.) to describe the behavior of the computations of the program.
- Periodically, this information is aggregated in a central process through a MRNet communication network. This software interconnects a set of processes in a tree-like topology, enabling scalable transmissions and synchronizations between them.
- The structure of the application is analyzed using clustering and time analysis techniques.
- The results of the analysis are transferred back to the tracing tool that is running within each process of the application, and representative regions of the whole execution are filtered.
The combined use of these tools enables us to produce a detailed yet small trace of representative time intervals, along with additional summary reports for the rest of the execution. For most cases of analysis, our technique achieves trace size reductions of several orders of magnitude compared to an indiscriminate full-run trace.

Cluster analysis for structure detection
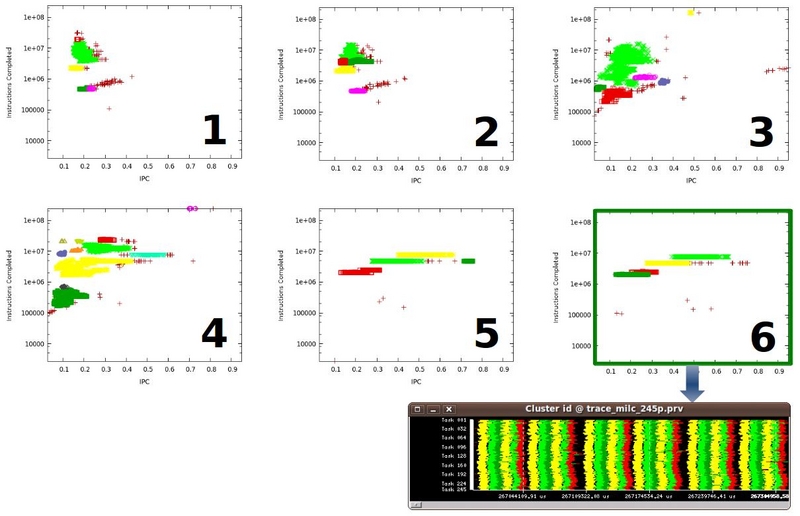
This technique is targeted towards exposing the structure of the program with respect to selected performance metrics. Cluster analysis is applied periodically during the execution until we detect that the behavior of the application remains stable. Such state is generally found when the application enters its main computing phase, for which we automatically generate a small trace describing this activity in detail.
In the following images you can see how the structure of the benchmark 104.milc from the SPEC MPI2007 progresses with time. When the application behavior stabilizes, the last time interval is selected as the main representative of the application behavior to produce a full detailed trace.
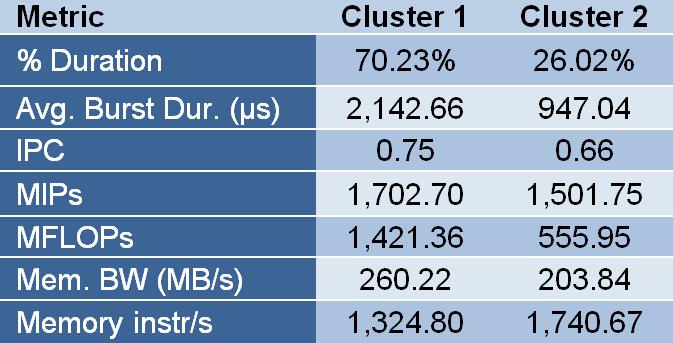
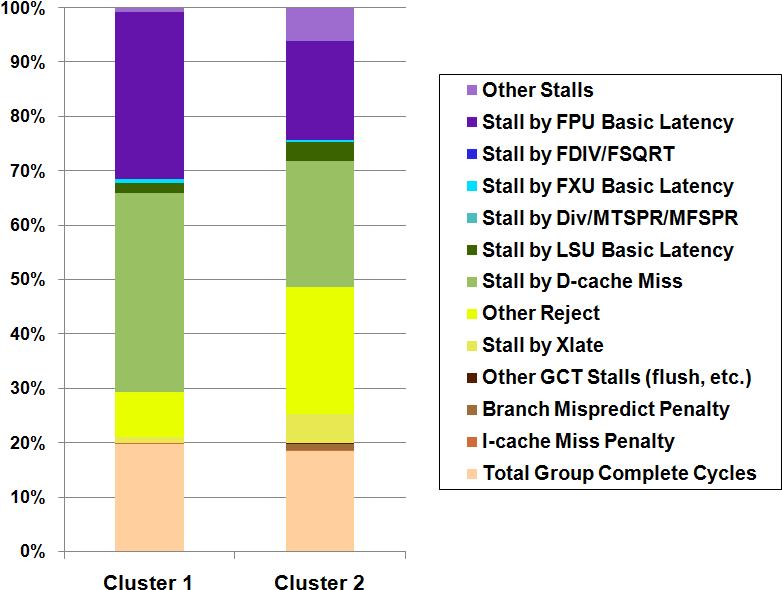
For every cluster, the tool reports an extensive list of metrics (small excerpt on Fig 4), which can be used to compute CPIStack performance models (Fig 5) to break-down the speed of the processor among its different components.
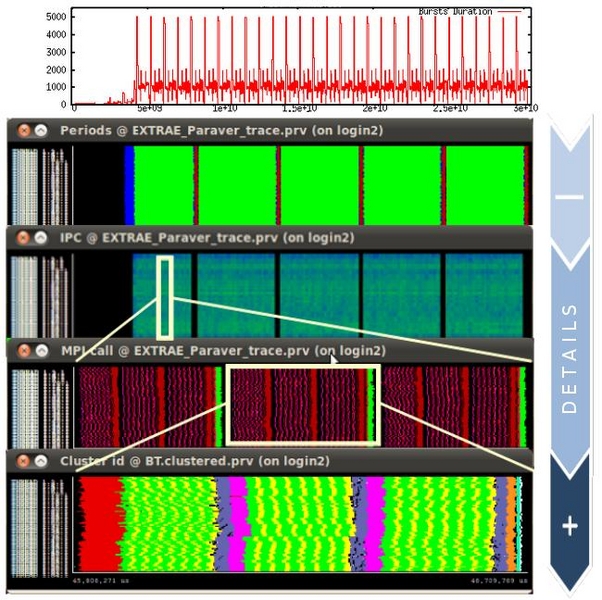
Time analysis for periodicity detection
This technique enables to detect iterative patterns over a wide region of time, and precisely delimit where the iterations start and finish. Once a period is found, those iterations presenting less perturbations are selected to produce a representative trace. The rest of the data beyond the selected iterations can be discarded, or summarized to provide low granularity information for the rest of the execution.
A single trace comprising multiple levels of detail for different time intervals provides full coverage of the whole execution while preserving the highest detail for the most representative regions.
|
|
| Full-run periodic structure |
| Phase profile summaries (HWC metrics, MPI stats) |
| Samples for every periodic pattern in full detail |
| Internal computation structure |